Everything you need to know about baseline supply chain data and visibility
Visibility into your supply chain is what you need in order to run it effectively.
Visibility into your supply chain is what you need in order to run it effectively.
If you can see what’s happening in your supply chain, you are better able to keep things moving smoothly and act swiftly if anything goes awry. Good data visibility can make the difference between a supply chain that is a proactive, strategic asset and one that is a reactive, stressful mess.
The problem is, for as much as we all love to tout the benefits of supply chain visibility (especially ‘end-to-end visibility’), it’s become increasingly difficult to agree on what that really means.
And that lack of alignment is where a lot of businesses get into trouble. What they thought was going to provide full visibility only gives them part of what they were looking for, or doesn’t go as deep as they hoped or sometimes it goes far too deep and stops being useful.
Luckily, digital tools give us the ability to build a solid base of data that can give us the visibility we need.
There are lots of different tools and techniques for gaining greater visibility into your supply chain. But what it really comes down to is making sure that you have the tools to access the kind of data you actually need. Not too much, not too little.
For most, that will mean implementing some kind of platform or tool to get the right kind of visibility. Most of these fall into the category of ‘control towers’. But there are also options like what we do here at 7bridges, which offer greater ability, agility and control than the usual solutions.
How many of us want to create a supply chain that is more responsive, visible, sustainable and resilient, but find there is no clear jumping-off point? There are so many things that need to be addressed and so many competing priorities, it can be hard to know where you need to start.
What can make all of that worse is out-of-date processes, little real visibility and a lack of resources to manage the sheer amount of data, invoices and charges from your logistics service providers (LSPs). Not to mention making sure that any data you do have is actually useful and usable.
When it comes to the specifics, we find that most supply chain leaders are struggling with some version of these issues:
These are all really common data and visibility challenges for supply chains. And the way to tackle them is to enlist help. Whether that’s through additional hiring or through investing in technology to make it easier.
Integrating a sustainable, scalable supply chain management platform can prepare you to turn your supply chain data into a competitive edge that drives profitability, increases resilience and visibility and moves your supply chain from reactive to proactive.
At 7bridges, we help you overcome your data and visibility struggles first with our baseline & benchmarking layer. Because it requires no IT resources from your side, it’s an easy win that sets up your data foundation so you can make impactful data-led decisions in the future.
To do this, we create a detailed baseline of the performance of your logistics service providers and freight forwarders to understand if you are getting the agreed service at the agreed prices. This helps you gain a real understanding of where your supply chain is at now.
With this layer in place, you can drive performance from your suppliers, develop more equitable, revenue-protecting contracts and also get detailed analytics on transportation and logistics performance and spend across your whole network. This can form the backbone of future optimisation opportunities.
Baseline & benchmarking data is, essentially, your starting point. It’s the information you need to understand exactly where you are and how your supply chain is performing right now. The reason you need that data is simple: without knowing where you’re starting from, you can’t plan for where you’re going. And, ultimately, that’s the goal with supply chain data. You need it to be accurate and visible so that you can make the right decisions for your goals. We break this down into two different kinds of data based on the lens you're using to think about them.
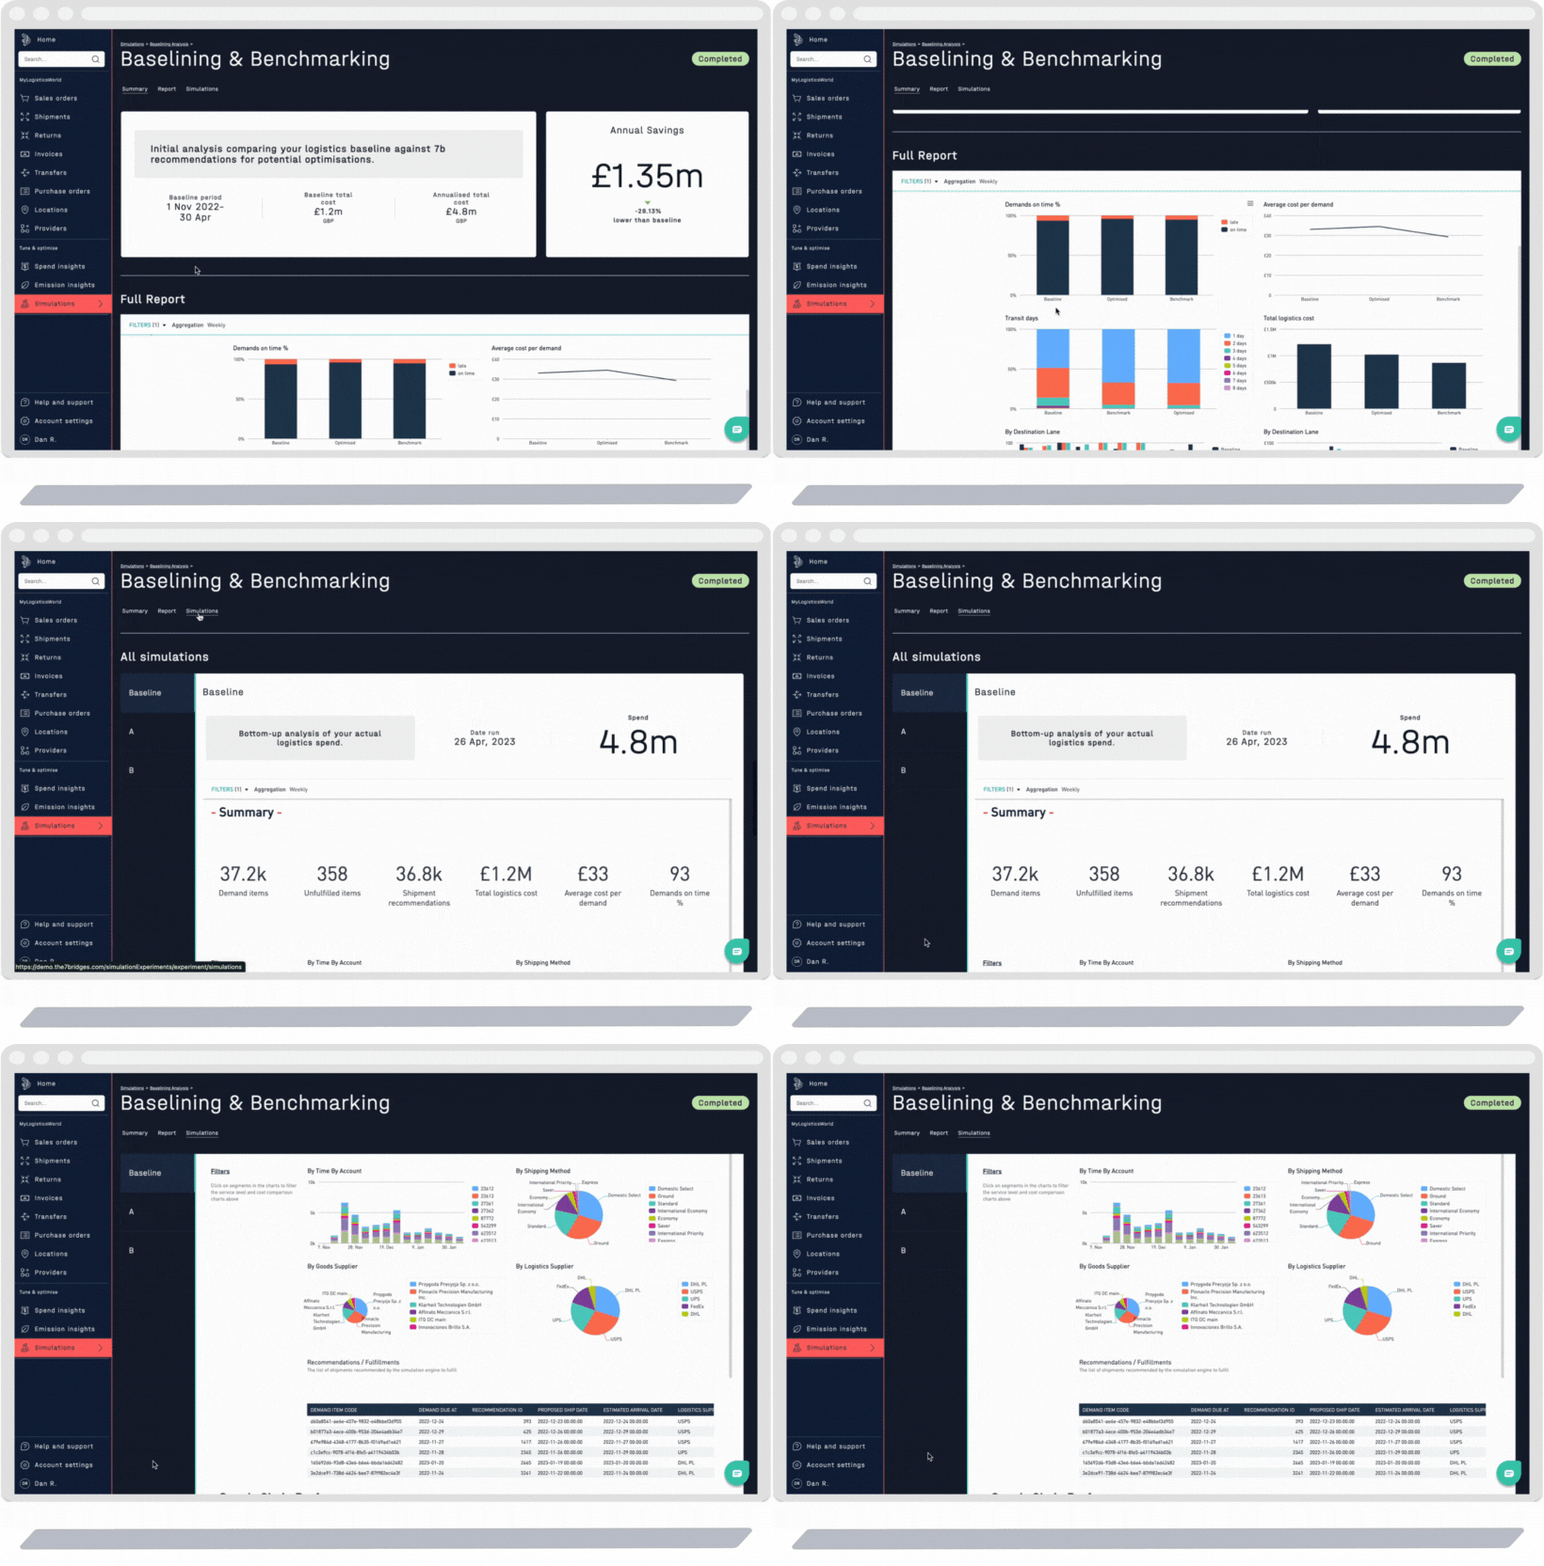
The Optimise part of the platform takes in your supply chain data through your invoices and then gives you a complete set of data to establish your baseline performance. This data is normalised, cleansed and much more granular than what you can get out of your invoices without the platform. This provides you with complete visibility of your service levels, costs and even CO2 emissions across your network.
For some, visibility needs to go beyond simply seeing the data into understanding the data. For these supply chains simulations can offer greater insight into what the available data really means and can kick off the initial actions to start making better decisions.
After the platform retrieves your provider data and gains an overview of your supply chain performance, you'll receive valuable insights to optimise your network using our simulation technology.
Our baseline and benchmarking simulations offer three levels of analyses, helping you answer important questions about your supply chain.
Baseline simulations help you gather a clear set of baseline data for the way your supply chain currently exists. These are designed to help you understand what’s working and what isn’t. Over time, as you start acting on the data from these simulations, you’ll see your supply chain become more efficient.
The baseline simulations will help identify the difference between what level of service you’ve paid for and what level of service you’ve actually gotten.
The difference between simulated service levels and actual service levels should help you see if you are being overcharged for the current performance levels and to know if you’ll need a more in-depth audit analysis. From the simulation, you’ll get a breakdown of your current supply chain network that can provide an analysis on provider utilisation, lane traffic, cost centres and more. All of which can help you know if you’re getting the most out of your provider contracts.
This also creates a baseline set of data to use in future simulations, helping you to run future simulations more easily.
Some simulations are outward-looking ones we mentioned earlier. This part is all about comparing your baseline to the wider industry. By automatically finding an industry peer, the platform anonymously compares your supply chain network performance. Are you using the right carriers? Are others in your sphere getting better deals? Are they getting better performance? This simulation will show you new opportunities to build the right network for your business. And the insights you’ll get out of it can help you carry out a procurement exercise to get the best rates available to you.
There are many different kinds of simulations you can do with the baseline and benchmarking layer. As mentioned above, these fall into the three categories of “baseline”, “optimisation” and “benchmarking”. Below are a couple of specific examples of the kind of questions you can ask your supply chain. These aren’t exhaustive, but can give you a good insight into the baseline & benchmarking simulations.
Improving your logistics network is a major factor in both business growth and customer satisfaction. However, many supply chain leaders struggle to get data-driven insights for network and provider improvement.
It's hard to find better ways of doing so because the work is time-consuming, there’s limited visibility into industry data (making it harder to justify allocating more resources to it), and finding reliable comparisons with similar organisations is challenging.

As well as outlining, the best "on-time" service provider options and destinations as well as the most cost-effective shipping methods, destinations, and suppliers.
These simulations work toward your strategic business goals through flexible “constraints,” which are more nuanced than typical “yes/no” rules that many software platforms give you.
Because of that, the baseline & benchmarking layer can do things such as recommending the most efficient and effective suppliers, methods, destinations, and other options based on your specific requirements.
These data-based and personalised constraints allow you to maximise your supply chain network and ensure customer satisfaction in the best way possible.
You need the best rates from your logistics providers so that you can serve your customers as efficiently and effectively as possible. But without visibility into benchmarked rates across the industry, you'll be at a disadvantage compared to your carriers. You won’t have the data to compare service levels and prices on a like-for-like basis, which limits your agility.
For leaders shipping either domestically or abroad, this potentially means getting a less than ideal service and paying higher costs.
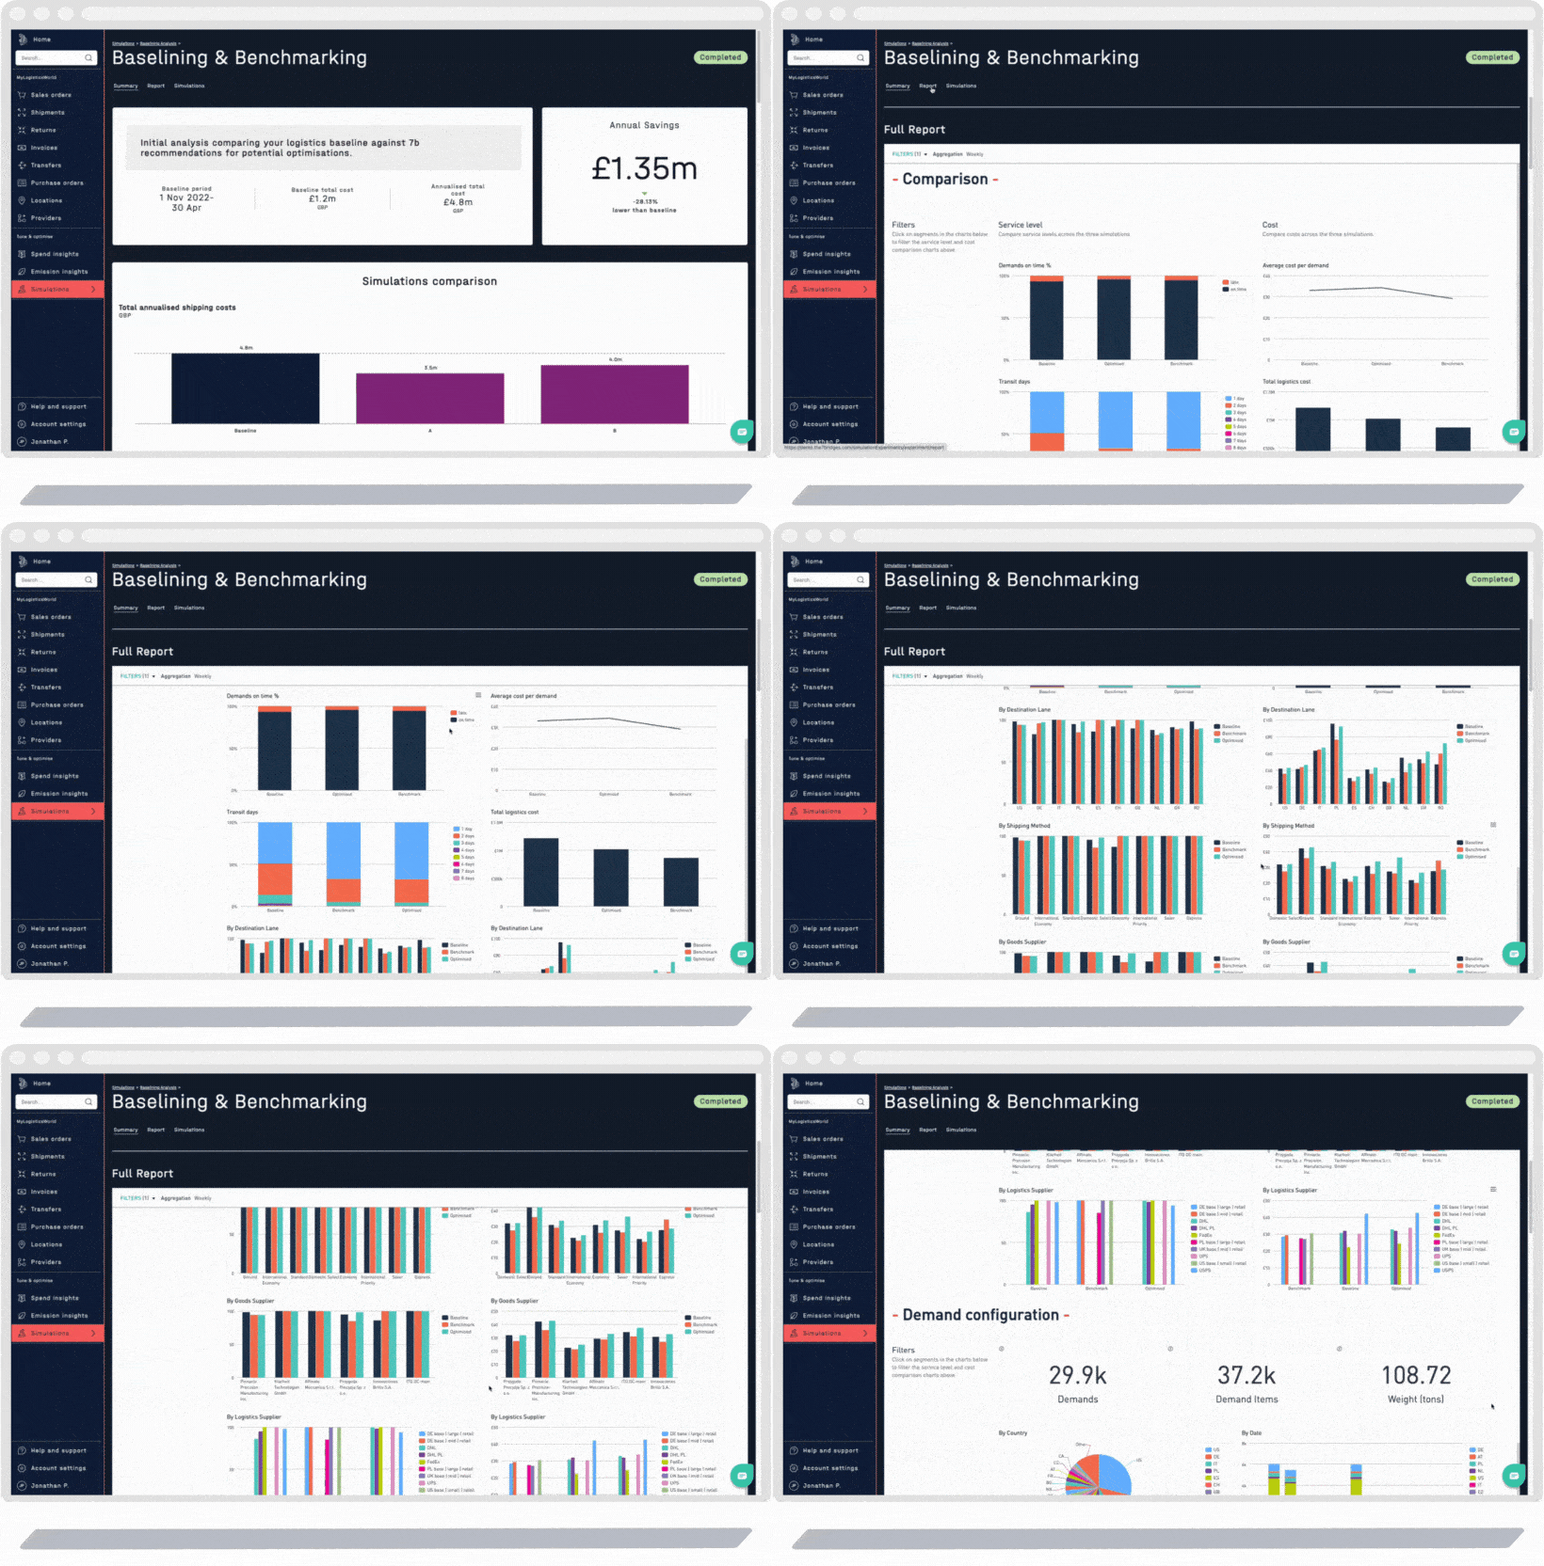
With the benchmarking part of our platform, you’ll have a clear and informative overview of your network. We’ll pull your data together in a way that is easy to understand and use for comparisons. These insights are delivered through three main reports.

That will give you insight into all the previously mentioned performance metrics, but with the comparison of how other businesses like yours are performing. From that, the report can provide you with an annual total figure of how much you could be spending.
This supply chain visibility can help you gain negotiation leverage to better manage your carriers, understand the impact of changes in your network and make sure you’re delivering your product in the most cost-effective way possible, while striking a balance with all of your other strategic needs.
Of how we can enable you to leverage the power of data to make improvements within your supply chain.